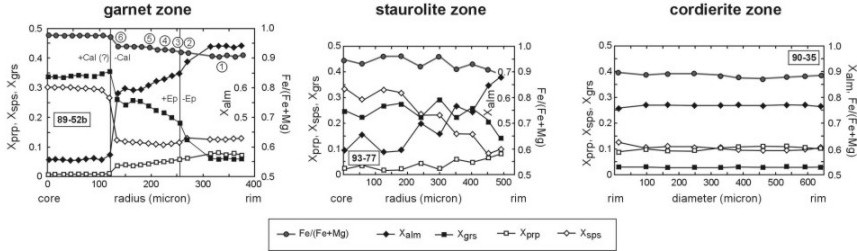
Representative garnet profiles of the main metamorphic zones of the Kluane metamorphic assemblage. Distinguished compositional zoning in garnet and staurolite zone garnets are in contrast with homogeneous composition of higher grade cordierite zone garnets. Core to rim decrease of the grossular (Ca) and spessartine ( Mn ) components coincide with increase of almandine (Fe) and to a lesser degree pyrope (Mg) components. This implies change of metamorphic conditions from relative high pressure-low temperature to lower pressure-higher temperature. Garnets of the cordierite zone were either completely homogenized due to diffusion at high temperatures, or as in this case represent new growth. Microphotographs of staurolite zone and cordierite zone garnets.

Locations of the reactions was calculated by using the software TWQ (v. 2.02b) by Rob Berman (1997). Mineral assemblages analyzed for staurolite zone samples (top row) are garnet, biotite , muscovite and plagioclase, for cordierite zone samples (bottom row) garnet, cordierite, biotite and plagioclase. Garnet rim and matrix biotite values were used.

P-T diagram of schist and gneiss samples from the Kluane metamorphic assemblage. P-T estimates are obtained by intersection of the SGAM and GASP barometers with the Grt-Bt thermometer. The GASP barometer is interpreted as the upper P-limit, since it includes slow-diffusing Ca-components. These are not included in the SGAM, which, however, is susceptible to Fe-Mg exchange between garnet and biotite during cooling, reducing the apparent pressure. Thus, it is seen as the lower pressure limit. For most samples though GASP and SGAM intersections are within 1 kbar. H&M denotes the Holdaway & Mukhopadhyay And- Sil reaction locality. (If you want to recalculate P-T, the microprobe data are available through Journal of Metamorphic Geology internet data repository: garnet , biotite , muscovite, plagioclase and cordierite.)

Map showing the geographical and mineral zone relation of P-T estimates.

P-T-t paths for the KMA. The blue curve is the proposed path for structurally lower portions, and the red curve for structurally higher portions of the schist. Geochronological data is from U-Pb (zircon, monazite) and Ar-Ar (biotite, muscovite) from KMA schist and granitoid dikes, analyzed by Jim Mortensen.